XRP price failed to surpass $1.680 and started another decline. The price is now correcting gains and might struggle to stay above $1.450.
- XRP price started a downside correction and declined below $1.550.
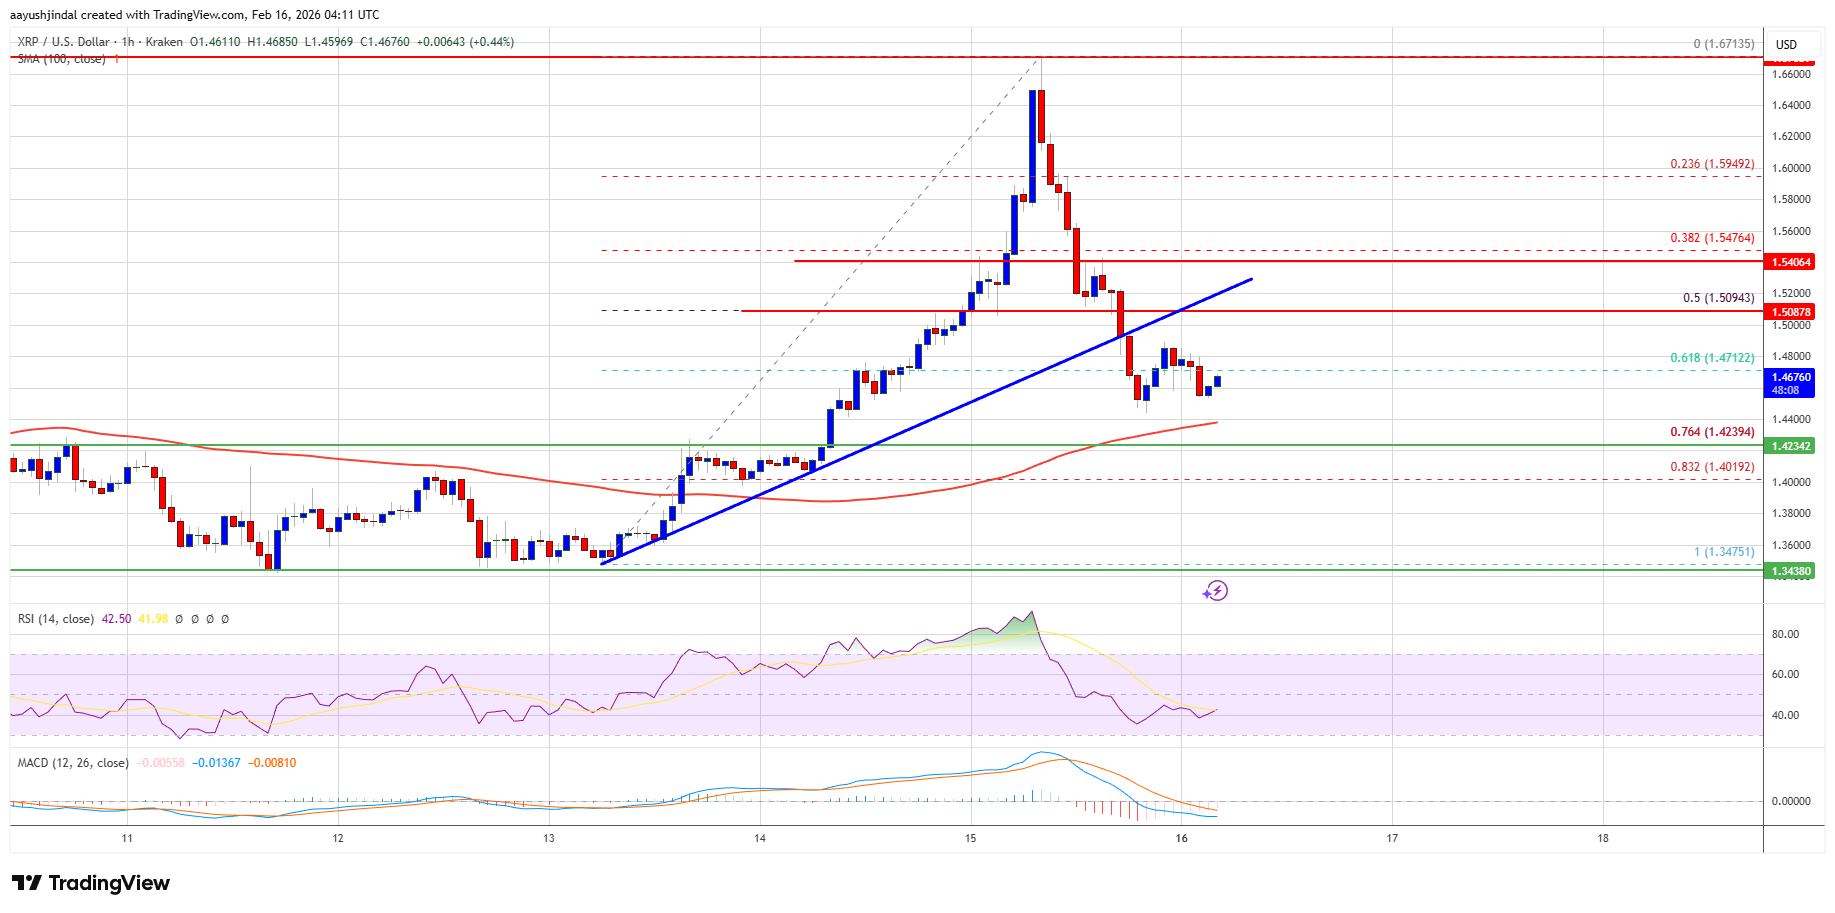
- The price is now trading above $1.450 and the 100-hourly Simple Moving Average.
- There was a break below a key bullish trend line with support at $1.4880 on the hourly chart of the XRP/USD pair (data source from Kraken).
- The pair could start another increase if it stays above $1.440.
XRP Price Rally Cools
XRP price failed to stay above $1.620 and started a downside correction, like Bitcoin and Ethereum. The price dipped below the $1.60 and $1.550 levels to enter a negative zone.
The price even dipped below the 61.8% Fib retracement level of the upward move from the $1.3475 swing low to the $1.6713 high. Besides, there was a break below a key bullish trend line with support at $1.4880 on the hourly chart of the XRP/USD pair.
The bulls are now active above the $1.450 zone. The price is now trading above $1.4620 and the 100-hourly Simple Moving Average. If there is a fresh upward move, the price might face resistance near the $1.50 level. The first major resistance is near the $1.510 level, above which the price could rise and test $1.5450.
A clear move above the $1.5450 resistance might send the price toward the $1.580 resistance. Any more gains might send the price toward the $1.620 resistance. The next major hurdle for the bulls might be near $1.640.
Downside Continuation?
If XRP fails to clear the $1.510 resistance zone, it could start a fresh decline. Initial support on the downside is near the $1.440 level. The next major support is near the $1.4240 level or the 76.4% Fib retracement level of the upward move from the $1.3475 swing low to the $1.6713 high.
If there is a downside break and a close below the $1.4240 level, the price might continue to decline toward $1.40. The next major support sits near the $1.360 zone, below which the price could continue lower toward $1.340.
Technical Indicators
Hourly MACD – The MACD for XRP/USD is now gaining pace in the bearish zone.
Hourly RSI (Relative Strength Index) – The RSI for XRP/USD is now below the 50 level.
Major Support Levels – $1.440 and $1.4240.
Major Resistance Levels – $1.50 and $1.510.


 English (US) ·