Ethereum is attempting to stabilize after an extended corrective phase. The asset is showing early signs of recovery from the $1.8k demand zone. However, despite the recent bounce, the broader market structure remains under pressure, and the current move appears more like a relief rally than a confirmed trend reversal.
The key challenge for bulls lies in reclaiming higher timeframe resistance levels while maintaining momentum. So far, every push upward has been met with selling pressure, suggesting that market participants are still using rallies as exit liquidity.
Ethereum Price Analysis: The Daily Chart
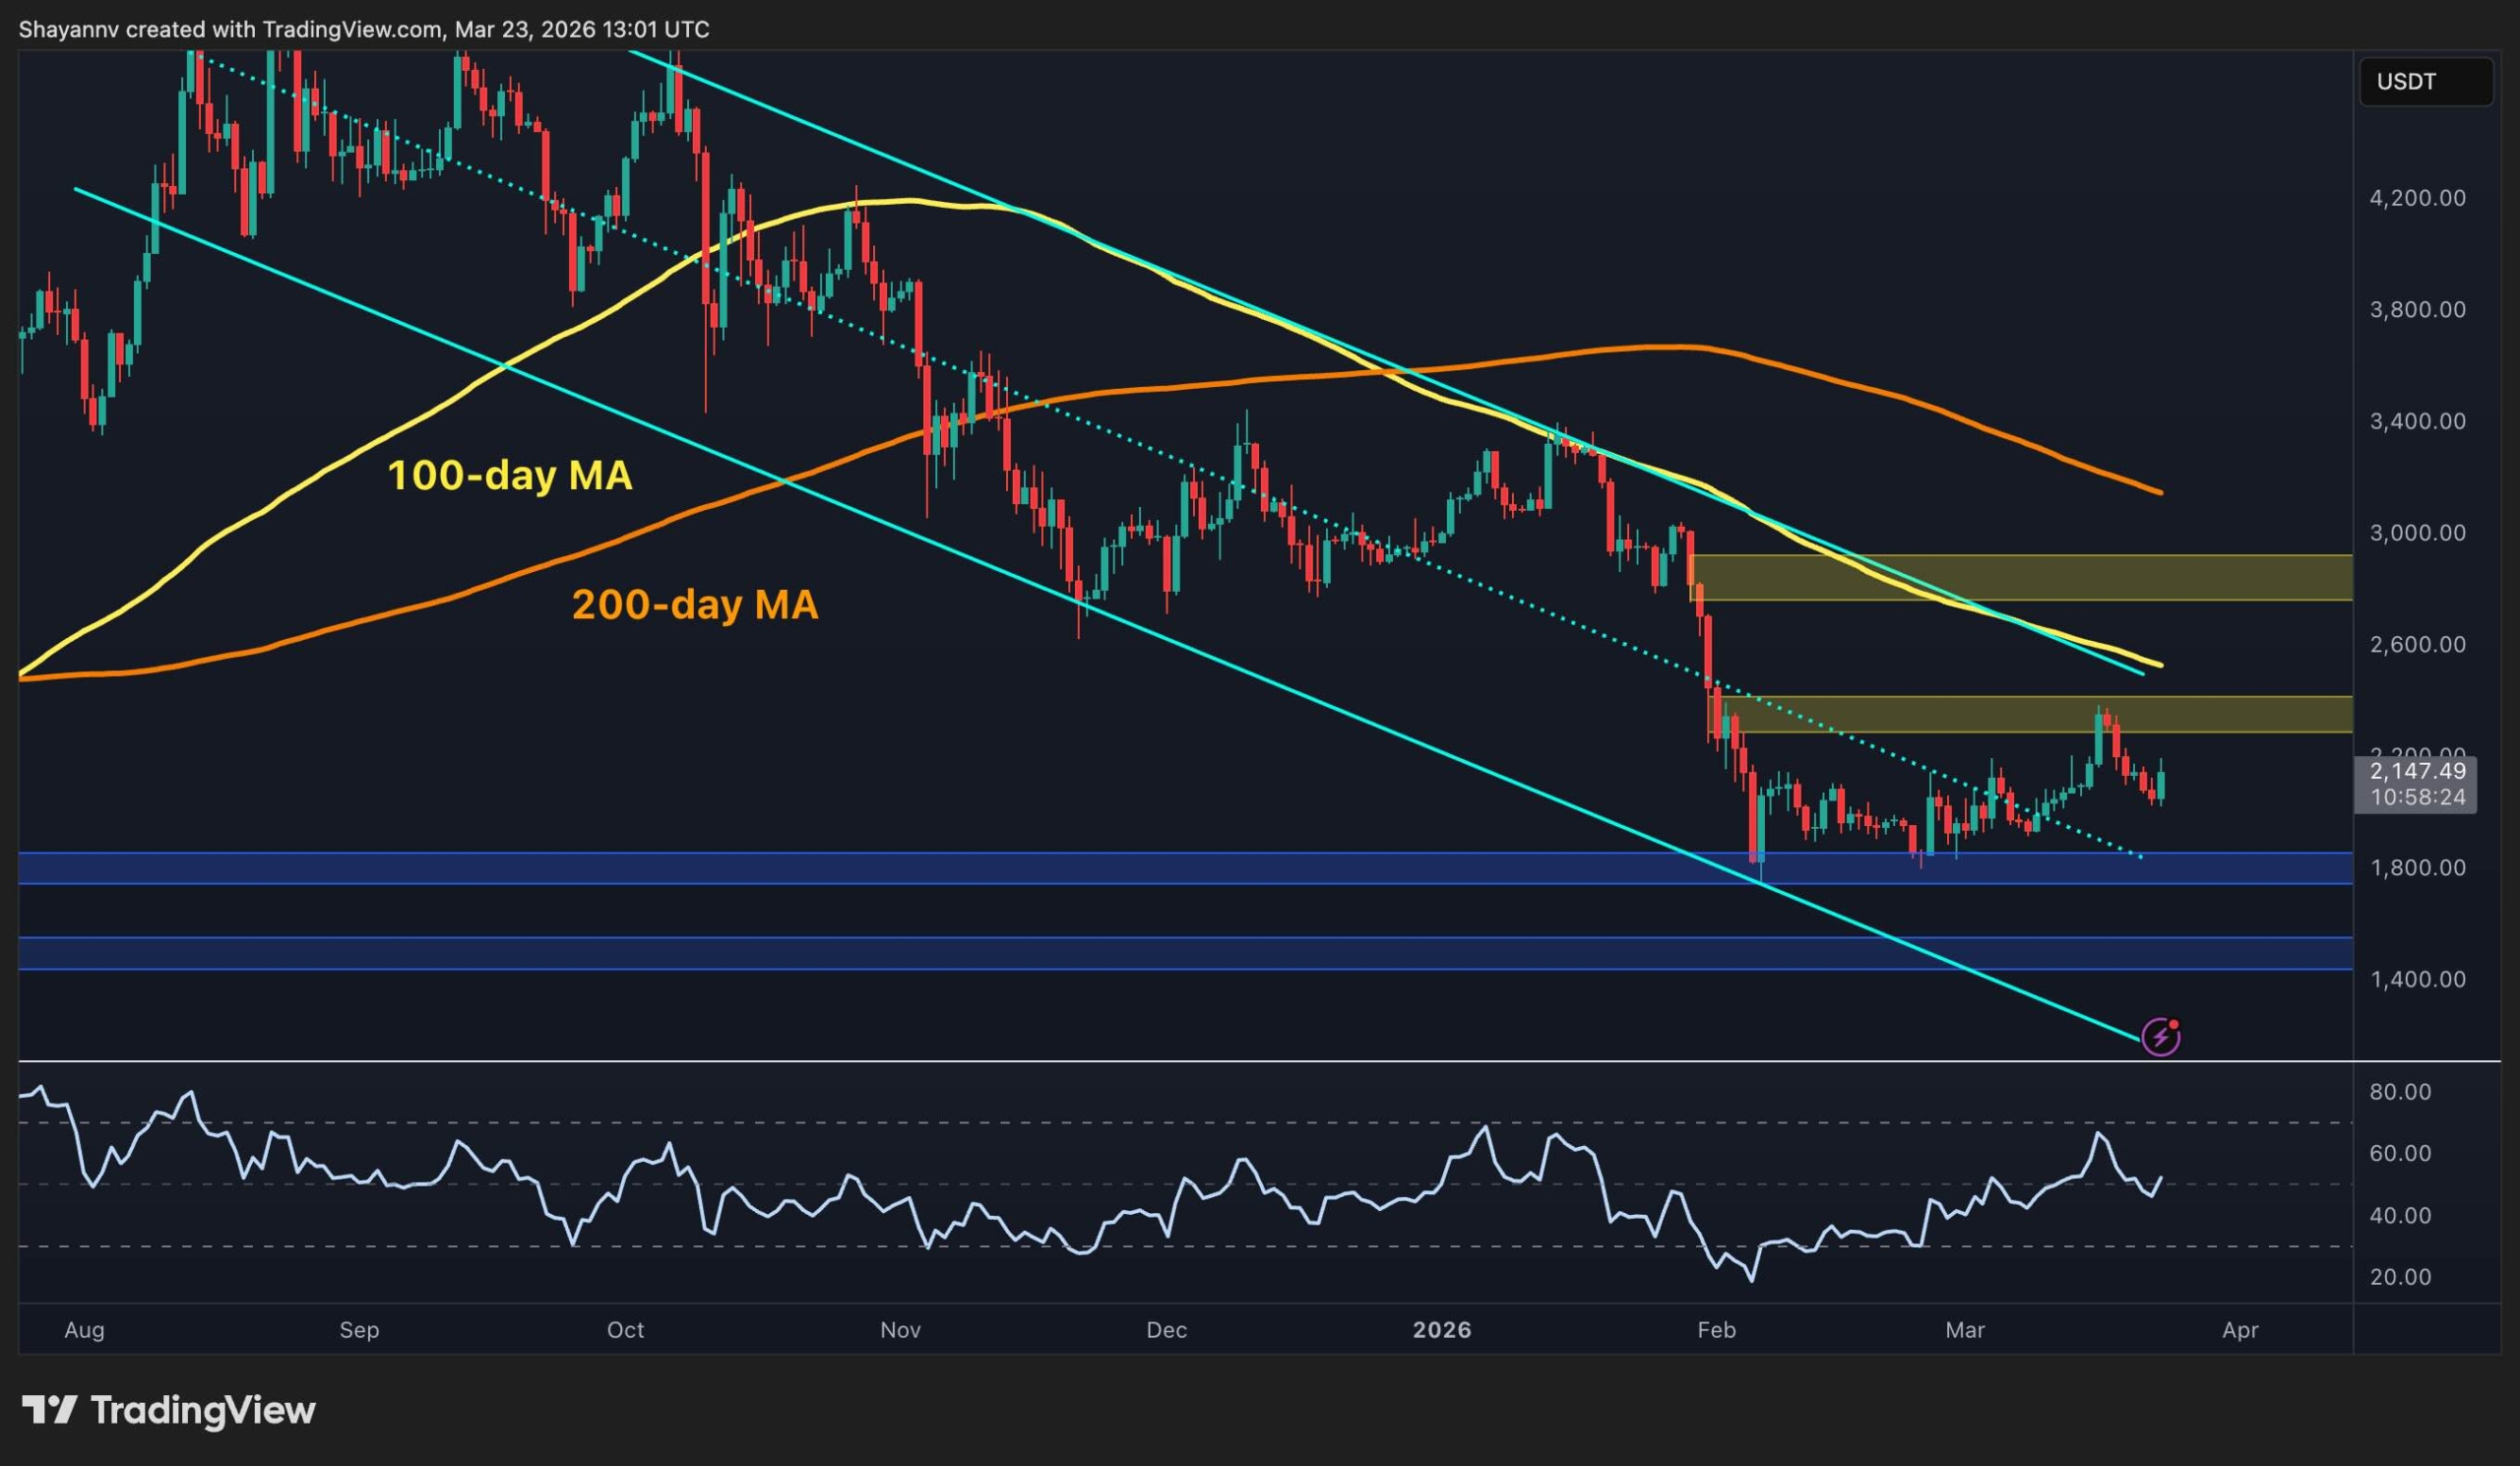
On the daily timeframe, Ethereum continues to trade within a well-defined bearish structure, printing lower highs and lower lows over the past few months. The price remains below both the 100-day and 200-day moving averages, located around the $2.5k and $3.2k marks, respectively. They are acting as dynamic resistance and reinforcing the overall downtrend bias.
The recent bounce from around $1.8k was technically significant, as this level has historically served as a strong demand zone. The move pushed ETH toward the $2.2k–$2.4k resistance region, which aligns with a previous breakdown area and a key supply zone. However, the price action has stalled here, with multiple rejections indicating that sellers are still firmly in control at higher levels.
A decisive daily close above $2.4k would be the first meaningful sign of strength, potentially shifting market structure and opening the door toward the next major resistance at $2.8k. On the downside, if ETH fails to hold above the psychological $2k level, the market could revisit $1.8k. A breakdown below this support would likely accelerate bearish momentum and expose lower levels, potentially triggering panic selling.
ETH/USDT 4-Hour Chart
Zooming into the 4-hour timeframe, ETH had been forming an ascending channel, which typically signals a controlled bullish retracement within a broader downtrend. This structure was supported by higher lows and relatively steady buying pressure.
However, the recent price action near the $2.3k–$2.4k resistance resulted in a fake breakout, where the asset briefly pushed above the channel resistance and supply zone, only to be quickly rejected. This type of move often traps late buyers and signals exhaustion in bullish momentum.
Following the rejection, ETH dropped back inside the channel and is now trading around $2,150. The loss of momentum is further confirmed by RSI, which showed an overbought signal at the recent highs, indicating that, despite higher prices, buying strength was weakening. Yet, in another interesting development, ETH has jumped significantly from the lower boundary of the channel, indicating that another test of the higher trendline and the $2.4k supply zone could be expected in the coming days.

Sentiment Analysis
From a sentiment perspective, the Taker Buy Sell Ratio has recently shown a noticeable uptick, moving toward and slightly above the neutral 1.0 level after almost 2 years. This indicates that aggressive buyers (market takers) are becoming more active, suggesting a short-term increase in demand.
However, context is crucial. This increase comes after a prolonged period where the ratio remained below 1.0, reflecting dominant selling pressure. In such scenarios, sudden spikes in buying activity during a broader downtrend can sometimes represent short-term relief rallies rather than the beginning of a sustained uptrend.
Additionally, the lack of strong follow-through in price despite rising buy pressure suggests that passive sellers are still absorbing demand. For a more convincing bullish signal, the ratio would need to remain consistently above 1.0 while being accompanied by higher highs in price.

The post The $2.4K Fakeout: Why ETH’s Latest Rally Might Just Be a Bull Trap (Ethereum Price Analysis) appeared first on CryptoPotato.


 English (US) ·