After the aggressive sell-off toward the $1.8K region, the market has transitioned into choppy consolidation, while lower timeframes are now approaching a decisive breakout point. The key question is whether this compression resolves to the upside or results in continuation within the dominant downtrend structure.
Ethereum Price Analysis: The Daily Chart
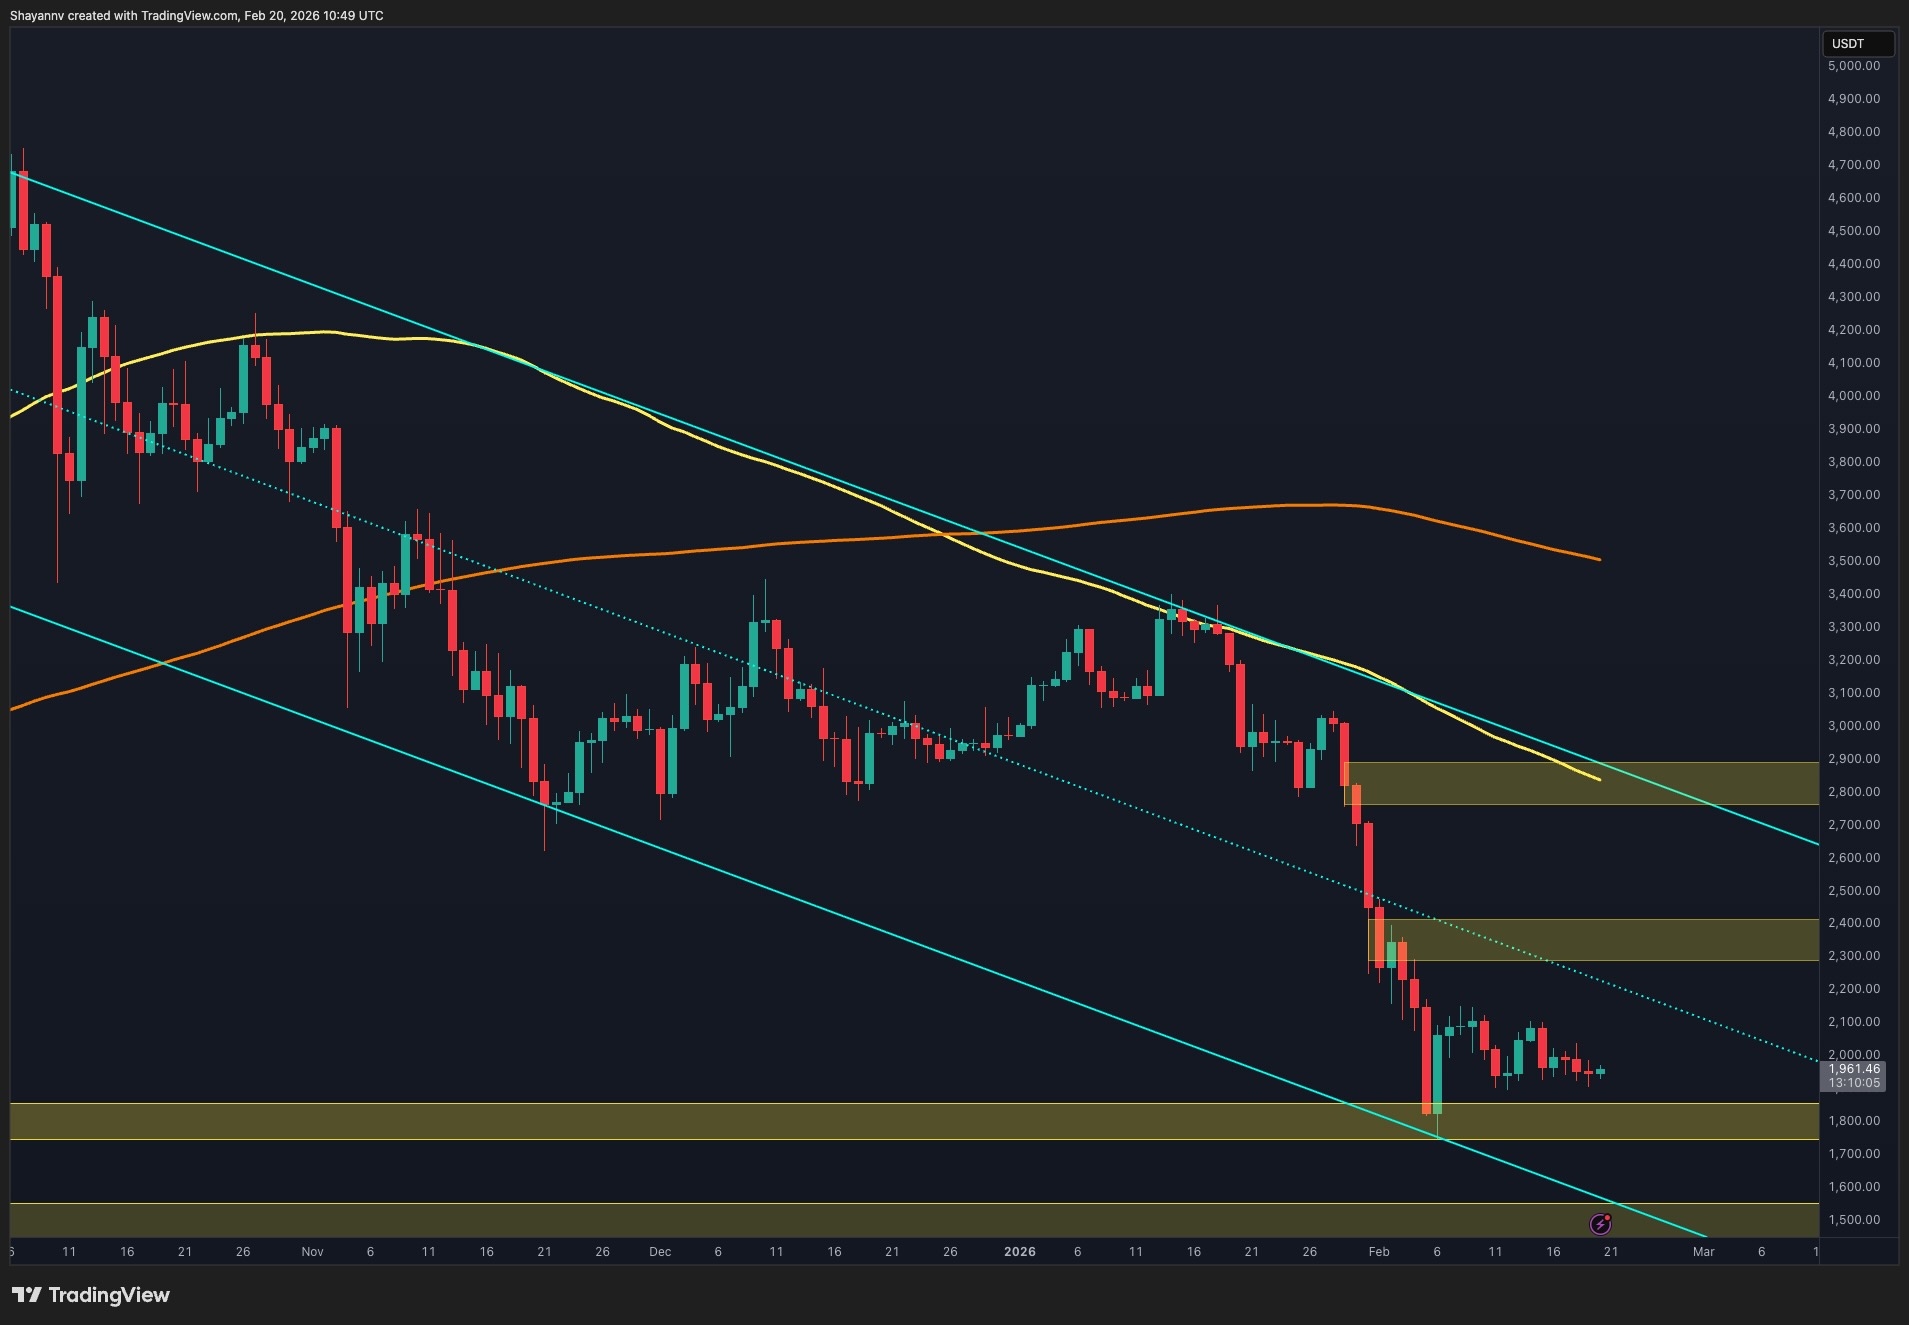
On the daily timeframe, ETH continues to trade inside a descending channel, with the midline acting as dynamic resistance and the $1.8K region serving as a firm structural base. Following the aggressive sell-off, the price action has turned increasingly choppy, printing overlapping candles and minor retracements rather than impulsive continuation. This behavior signals equilibrium and indecision.
The consolidation remains confined between the channel’s mid-boundary above and the $1.8K demand zone below. Each attempt to push higher has been capped before reclaiming a meaningful resistance cluster, while sellers have failed to generate a decisive breakdown beneath the base. Until one of these boundaries is violated, the dominant expectation is continued range-bound fluctuation.
A confirmed breakout above the midline would open the path toward the next resistance zone around the $2.3K–$2.5K region. Conversely, losing $1.8K would invalidate the equilibrium and likely trigger another bearish impulse.
ETH/USDT 4-Hour Chart
On the 4-hour timeframe, the price compression is more evident. ETH has formed a clear triangle pattern, defined by descending resistance and rising support. The structure reflects volatility contraction and is now approaching its apex, suggesting that a breakout is imminent.
The recent higher lows inside the pattern indicate improving short-term demand, increasing the probability of an upside resolution. However, as long as ETH remains capped below the 0.5 Fib at $2,396, the structure remains technically corrective within a broader downtrend.
A confirmed breakout above the triangle, followed by a reclaim of $2,396, would shift short-term momentum toward the 0.618 level at $2,549 and potentially the 0.702–0.786 retracement cluster near $2,658–$2,767, which also coincides with a marked supply zone on the chart.
On the downside, failure to break upward and a decisive loss of the triangle’s ascending support would expose the $1,800–$1,746 base once again. In that scenario, the recent consolidation would resolve as a continuation pattern rather than a reversal attempt.
At this stage, ETH is at a technical inflection point, with Fibonacci resistance levels clearly defining the upside targets and the $1.8K base anchoring the downside risk.

Sentiment Analysis
The Taker Buy/Sell Ratio across all exchanges provides additional context for the current equilibrium. The ratio has remained below the 1.0 threshold for a prolonged period, indicating that aggressive market sells have dominated overall order flow. This aligns with the broader bearish structure observed on higher timeframes.
However, the recent rebound in the ratio and the stabilization of its 30-day EMA suggest that selling pressure may be weakening. Although buyers have not yet taken full control, the gradual recovery toward the neutral level signals improving demand. If the ratio decisively moves above 1.0 and sustains that level, it would confirm aggressive market buying and increase the probability of an upside breakout from the triangle structure.
Overall, Ethereum is positioned at a technical and derivatives inflection point. The daily chart reflects equilibrium, the 4-hour chart shows imminent compression resolution, and order-flow metrics suggest that bearish dominance is softening. A decisive break from the current structure will likely define the next impulsive phase.

The post Ethereum Price Analysis: 4-Hour Triangle Compression Signals Imminent Breakout appeared first on CryptoPotato.


 English (US) ·