Bad news has just been bad news over the past 24 hours. Friday’s weak U.S. jobs report bolstered bets on deeper Fed cuts, but bitcoin (BTC) hasn’t played along.
The leading cryptocurrency by market value remains heavy below $112,000, instead of rallying on the prospect of easier monetary policy as many had anticipated. The inability to find upside suggests potential for a deeper sell-off ahead.
NFP shock
Job seekers had a tough time in August as the nonfarm payrolls revealed just 22,000 job additions, significantly less than the Dow Jones' projection of 75,000. The report also revised the combined job creation over June and July by 21,000. Notably, the revised June figure showed a net loss of 13,000.
Nine sectors, including manufacturing, construction, wholesale trade, and professional services, registered job losses, while health services and leisure and hospitality were bright spots.
The Kobessi Letter called the jobs report "absolutely insane." The newsletter service described the downward revisions in prior months as a sign of a broken system and the labour market entering recession territory.
Following the jobs data, the probability of a Fed rate cut at the Sept. 17 meeting surged to 100%, and the odds of a 50-basis-point cut jumped to 12%. The likelihood of additional rate cuts in November and December also increased, sending Treasury yields lower.
The upcoming revisions to earlier jobs reports are expected to add fuel to the rate cut bets. "The BLS will announce annual benchmark revisions on Tuesday, and they are expected to point to even weaker job growth earlier. Some surveys suggest between 500k and 1 mln jobs could be revised away," Bannockburn Global Forex's Managing Director and Chief Market Strategist, Marc Chandler said in a market update.
BTC's double top is intact; volatility in Treasury yields may rise
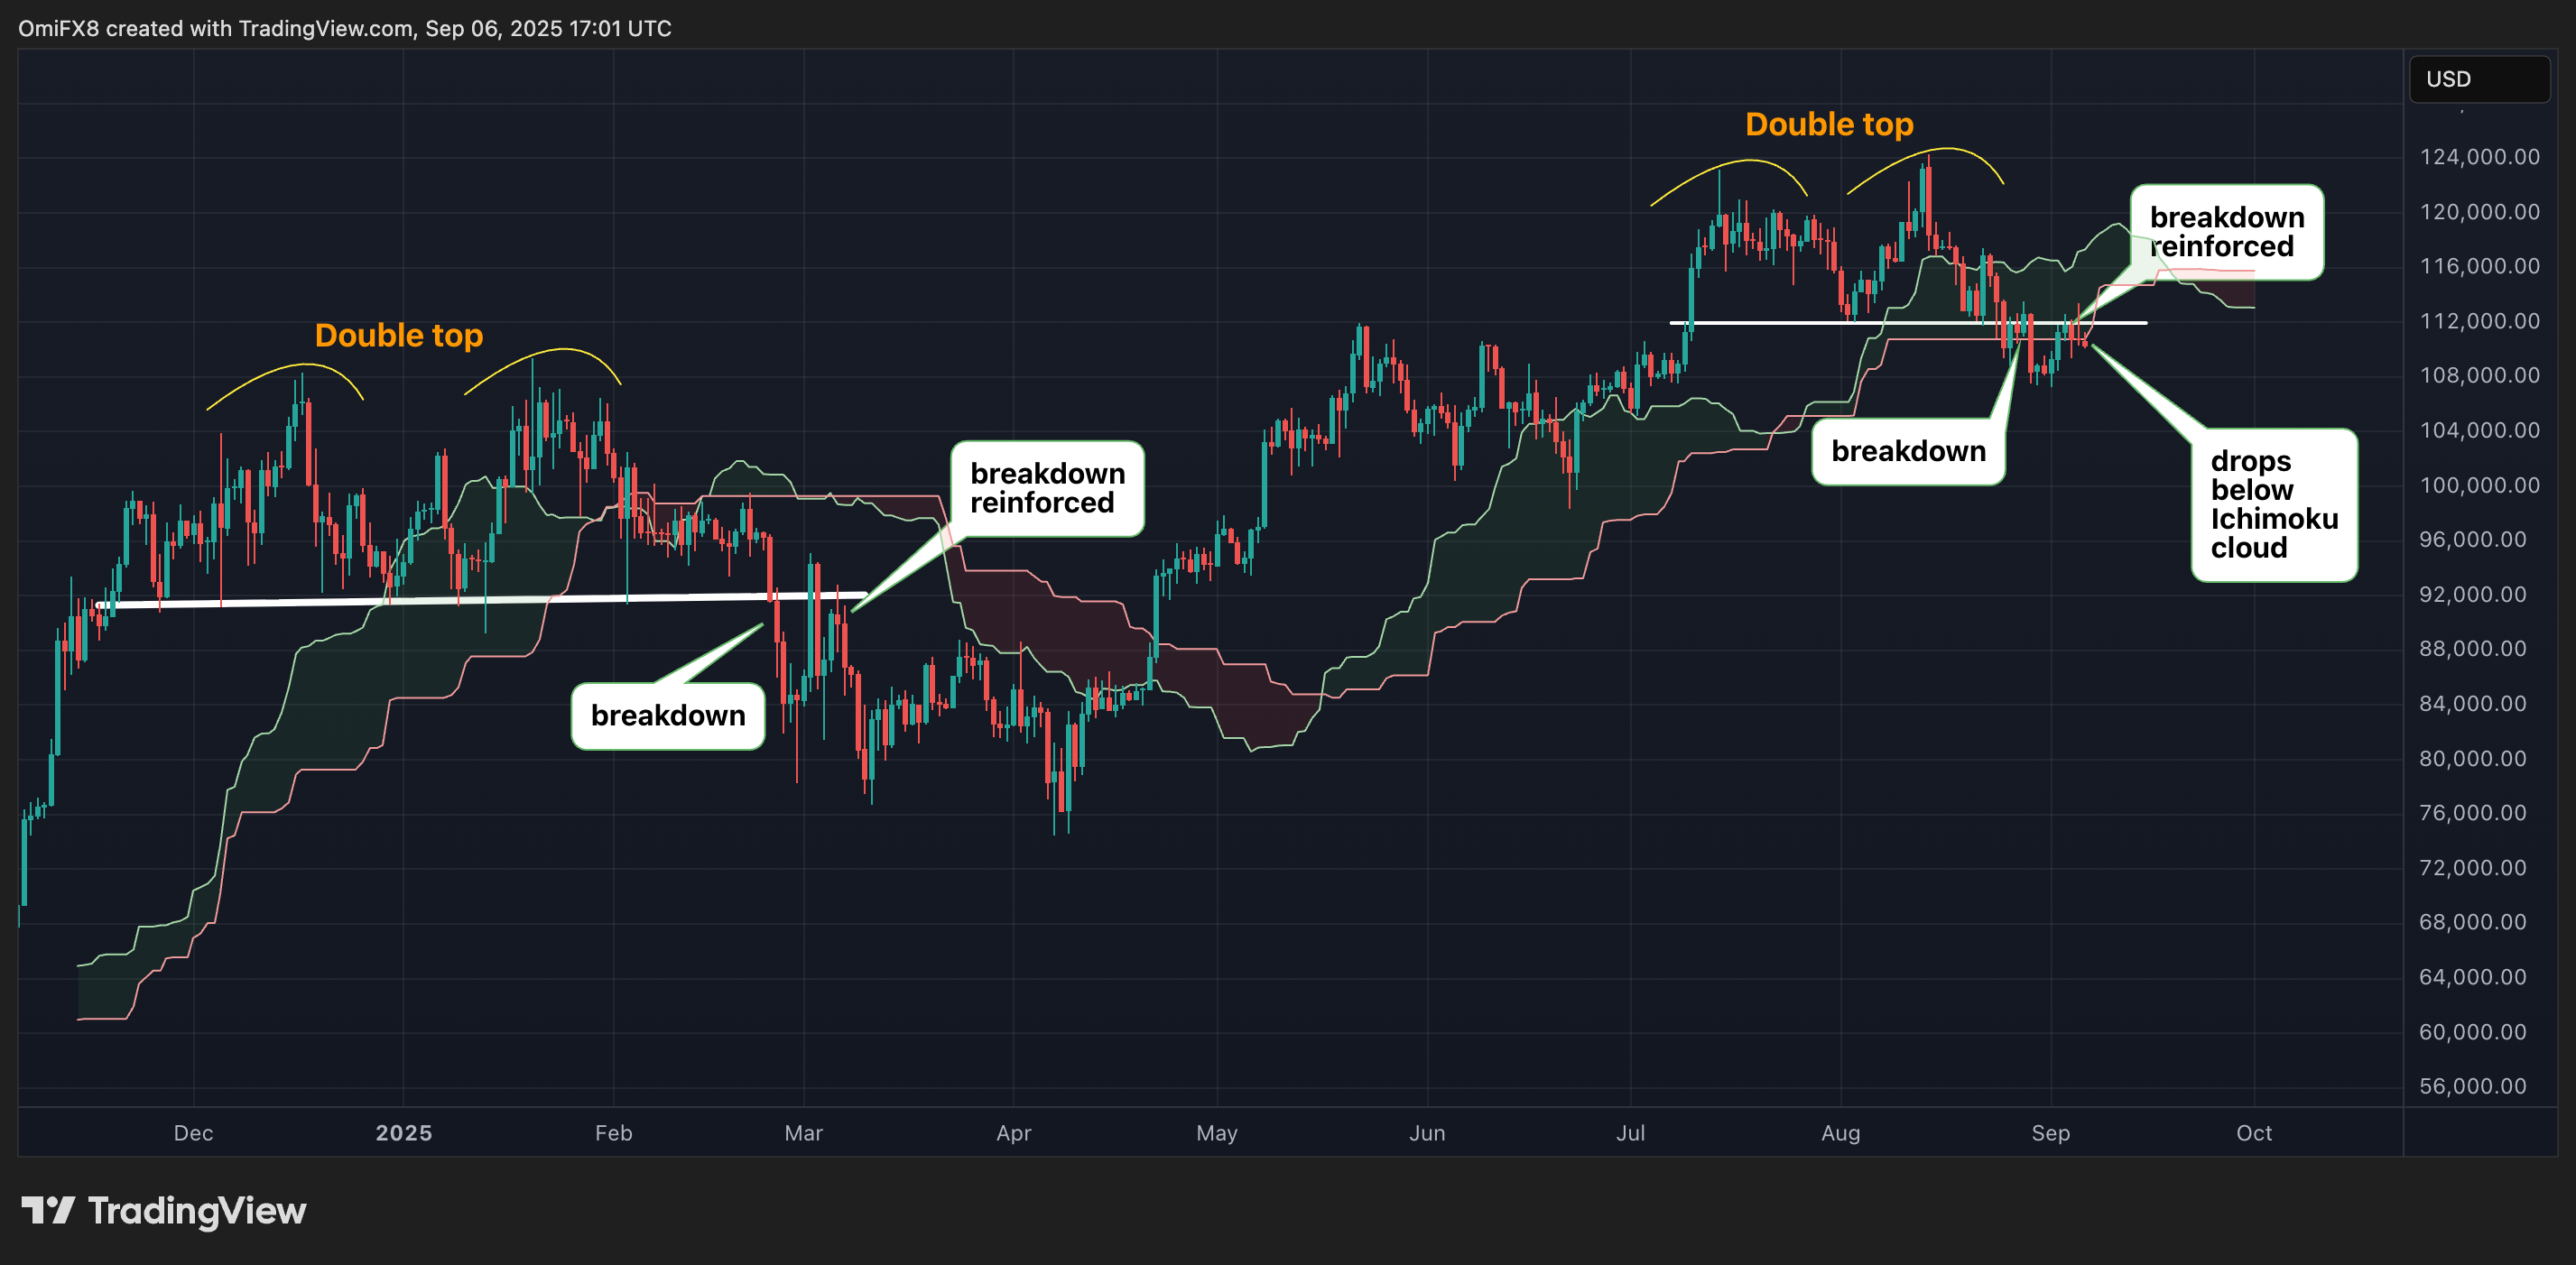
Bitcoin briefly rallied on hopes of a Fed rate cut and softer yields, reaching a high of over $113,300. But the bounce quickly faded, with prices slipping back under $111,982 — the double‑top neckline.
Failing to retake that level underscored the late August double top breakdown and validates the bearish setup, keeping downside risks in focus. Prices crossing below the Ichimoku cloud further validates the bearish outlook, as Brent Donnelly, president of Spectra Markets, noted in a market update.

The first line of support is located around $101,700, which corresponds to the 200-day simple moving average (SMA). The latest double top breakdown in bitcoin closely mirrors the one from February this year, which led to a significant multi-week sell-off that pushed prices down to around $75,000.
The double top is a bearish reversal chart formation that occurs after an asset has experienced an uptrend. It forms when the price reaches a high point (the first peak), then pulls back to a support level called the neckline. The price then rises again but fails to surpass the first peak, creating a second peak at roughly the same level. The pattern is confirmed when the price breaks below the neckline, signaling that the previous uptrend has lost momentum and a downtrend may follow.
Treasury yields may turn volatile
The bearish technical outlook, presented by the latest double top breakdown, is reinforced by the possibility of a pickup in volatility in Treasury yields, which often leads to financial tightening.
The volatility could pick up in the coming days, as the impending Fed rate cuts could initially send the 10-year yield lower in a positive development for BTC and risk assets. That said, the downside looks limited and could be quickly reversed, much like what happened in late 2024.
Last year, from September through December, the 10-year yield actually rose, even as the Fed began cutting rates, reversing earlier declines that had occurred in the lead-up to September. The 10-year yield bottomed out at 3.6% in mid-September 2024 and then rose to 4.80% by mid-January.
While the labour market today appears significantly weaker than last year, inflation is relatively higher, and fiscal spending continues unabated, both of which mean that the yield could surge following the September rate cut.
"Why the 10yr yield rose from September through December 2024 is open to interpretation, but there was an underpinning of macro resilience, sticky-ish inflation and lots of talk on fiscal largesse as a medium-term risk. This time around, granted, worries on the economy are more intense. But offsetting this are ongoing fiscal concerns, and quite a different inflation dynamic," analysts at ING said in a note to clients.
August CPI data due next week
When the Fed cut rates last September, the U.S. consumer price index was well below 3%. Since then, it has edged back up to 3%. More importantly, the August CPI data, due next week, is likely to provide further evidence of inflation stickiness.
According to Wells Fargo, the core CPI is likely to have risen by 0.3%, keeping the year-over-year rate at 3.1%. Meanwhile, the headline CPI is forecast to have risen 0.3% month-over-month and 2.9% year-over-year.

 5 months ago
241


 English (US) ·