Bitcoin has continued to trade in a precarious zone after months of relentless selling pressure from the October 2025 highs above $125K. The asset is currently hovering below $70,000, attempting to stabilize after a dramatic downtrend, but several technical and on-chain signals suggest the battle between buyers and sellers is far from over.
Bitcoin Price Analysis: The Daily Chart
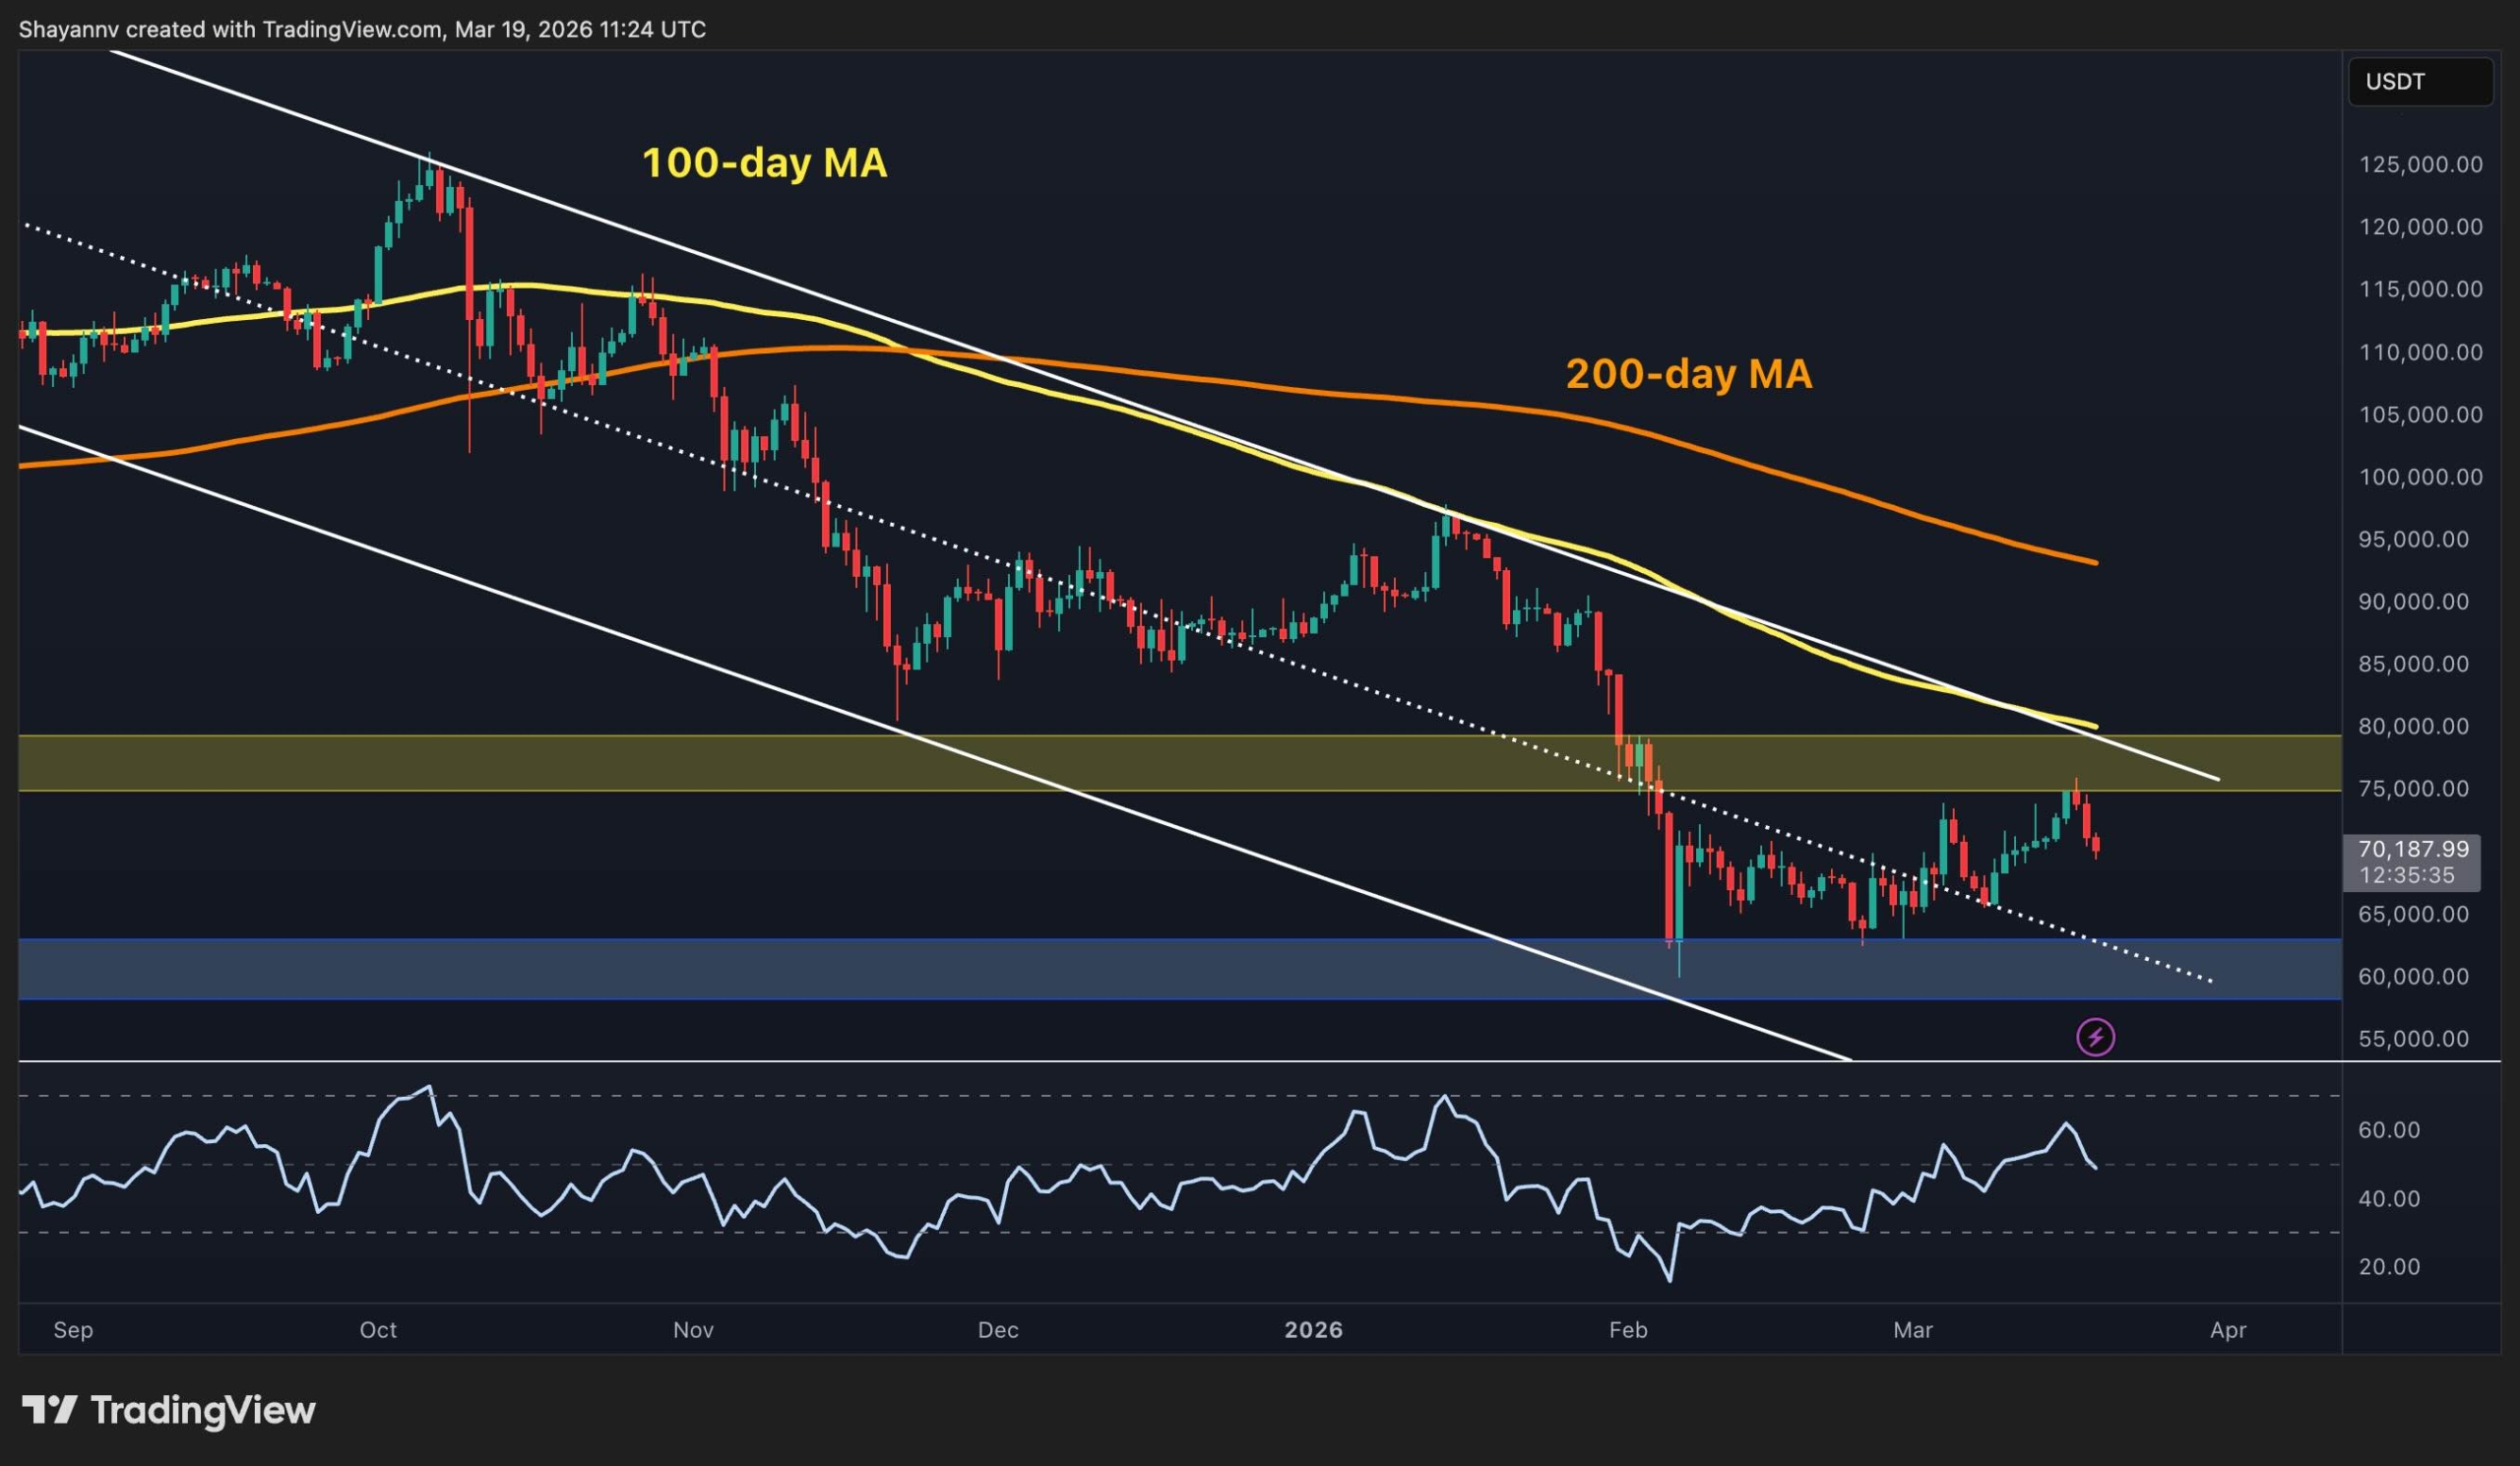
Looking at the daily timeframe, the broader picture remains firmly bearish. BTC has been trapped inside a descending channel since its peak above $125K, printing a consistent series of lower highs and lower lows. The asset is now trading well below both the 100-day and 200-day moving averages, which are acting as dynamic resistance overhead. The 200-day MA sits around $92K, and the 100-day near $80K, both far above the current price.
The daily RSI has recovered from deeply oversold territory, currently oscillating around the midline. A key horizontal support zone between $58K and $62K (highlighted in blue) held during the February capitulation wick, and that area remains the most critical floor to watch. For any meaningful reversal, however, the market would need to reclaim the $75K–$80K zone, which also aligns with the descending channel’s upper boundary.
BTC/USDT 4-Hour Chart
Zooming into the 4-hour chart, a more constructive short-term structure emerges. Since the early February lows near $60K, BTC has been forming an ascending channel pattern with higher lows, supported by a rising trendline. Yet, the price recently tagged the upper resistance near $75K before facing a decisive rejection and pulling back sharply toward $70k.
The area between $74K and $76K has acted as a stubborn supply zone, rejecting multiple attempts to break higher. The 4-hour RSI has also cooled off from overbought conditions and now sits below the 40 level, indicating a change in momentum to relatively bearish. A confirmed break below the rising trendline (~$66K) would likely accelerate selling toward $60K, while a push above $75K could trigger a squeeze toward $80K, and change the market outlook to bullish in the short-term.

On-Chain Analysis
The Exchange Whale Ratio, measuring the proportion of large transactions relative to total exchange inflows, has shown a notable spike in recent weeks. After months of relatively subdued whale activity during the prolonged downtrend, the ratio has jumped sharply from around 0.45 to above 0.6, signaling that large holders are becoming more active on exchanges.
Historically, sharp increases in this metric have coincided with periods of heightened volatility, as whales tend to move coins to exchanges either to sell or to reposition. The current uptick, combined with the price hovering near a technically sensitive zone, suggests that big players are preparing for a decisive move. Whether this translates into distribution (selling) or accumulation at these levels will likely determine BTC’s direction in the coming weeks.

The post Bitcoin Price Prediction: How Low Can BTC Fall If $70K Level Is Lost Decisively? appeared first on CryptoPotato.


 English (US) ·